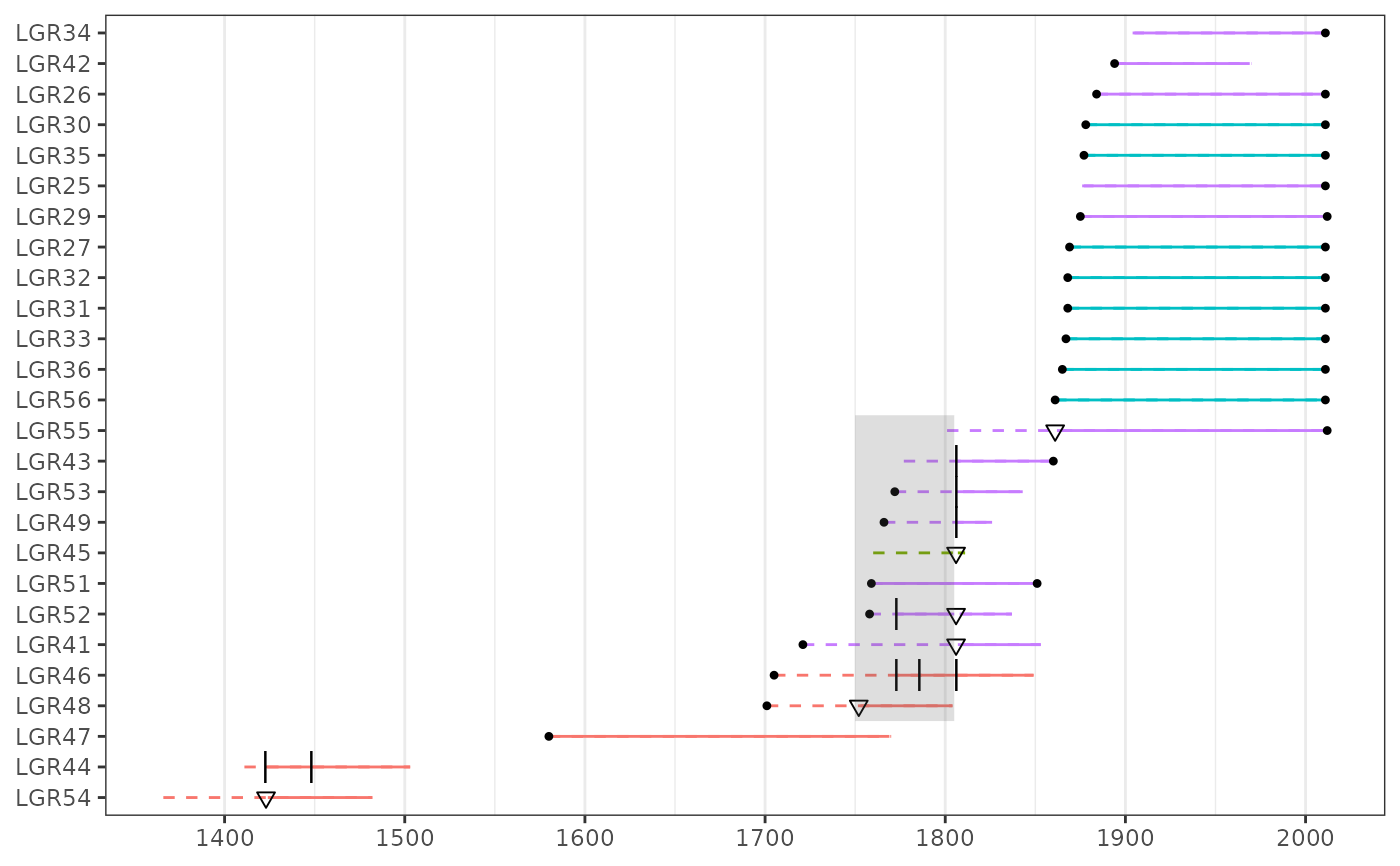
Create an ggplot2 object for plotting fhx demographics
plot_demograph(
  x,
  color_group,
  color_id,
  facet_group,
  facet_id,
  facet_type = "grid",
  ylabels = TRUE,
  yearlims = FALSE,
  composite_rug = FALSE,
  filter_prop = 0.25,
  filter_min_rec = 2,
  filter_min_events = 1,
  injury_event = FALSE,
  plot_legend = FALSE,
  event_size = c(Scar = 4, Injury = 2, `Pith/Bark` = 1.5),
  rugbuffer_size = 2,
  rugdivide_pos = 2
)
Arguments
- x
An
fhxobject, as fromfhx()- color_group
Option to plot series with colors. This is a character vector or factor which corresponds to the series names given in
color_id. Bothcolor_groupandcolor_idneed to be specified. Default plot gives no color.- color_id
Option to plot series with colors. A character vector of series names corresponding to groups given in
color_group.Every unique value inxseries.names needs to have a corresponding color_group value. Bothcolor_groupandcolor_idneed to be specified. Default plot gives no species colors.- facet_group
Option to plot series with faceted by a factor. A vector of factors or character vector which corresponds to the series names given in
facet_id.Bothfacet_groupandfacet_idneed to be specified. Default plot is not faceted.- facet_id
Option to plot series with faceted by a factor. A vector of series names corresponding to species names given in
facet_group.Every unique values inxseries.names needs to have a corresponding facet_group value. Bothfacet_groupandfacet_idneed to be specified. Default plot is not faceted. Note thatcomposite_rug,facet_group, andfacet_idcannot be used in the same plot. You must choose facets or a composite rug.- facet_type
Type of ggplot2 facet to use, if faceting. Must be either "grid" or "wrap". Default is "grid". Note that
composite_rug,facet_group, andfacet_idcannot be used in the same plot. You must choose facets or a composite rug.- ylabels
Optional boolean to remove y-axis (series name) labels and tick marks. Default is TRUE.
- yearlims
Option to limit the plot to a range of years. This is a vector with two integers. The first integer gives the lower year for the range while the second integer gives the upper year. The default is to plot the full range of data given by
x.- composite_rug
A boolean option to plot a rug on the bottom of the plot. Default is FALSE. Note that
composite_rugandfacet_group,facet_idcannot be used in the same plot. You must choose facets or a composite rug.- filter_prop
The minimum proportion of fire events in recording series needed for fire event to be considered for composite. Default is 0.25.
- filter_min_rec
The minimum number of recording series needed for a fire event to be considered for the composite. Default is 2 recording series.
- filter_min_events
The minimum number of fire scars needed for a fire event to be considered for the composite. Default is 1. Fire injuries are included in this count if
injury_eventisTRUE.- injury_event
Boolean indicating whether injuries should be considered events. Default is
FALSE.- plot_legend
A boolean option allowing the user to choose whether a legend is included in the plot or not. Default is
FALSE.- event_size
An optional numeric vector that adjusts the size of fire event symbols on the plot. Default is
c("Scar" = 4, "Injury" = 2, "Pith/Bark" = 1.5).- rugbuffer_size
An optional integer. If the user plots a rug, this controls the amount of buffer whitespace along the y-axis between the rug and the main plot. Must be >= 2.
- rugdivide_pos
Optional integer if plotting a rug. Adjust the placement of the rug divider along the y-axis. Default is 2.
Value
A ggplot object for plotting or manipulation.
Examples
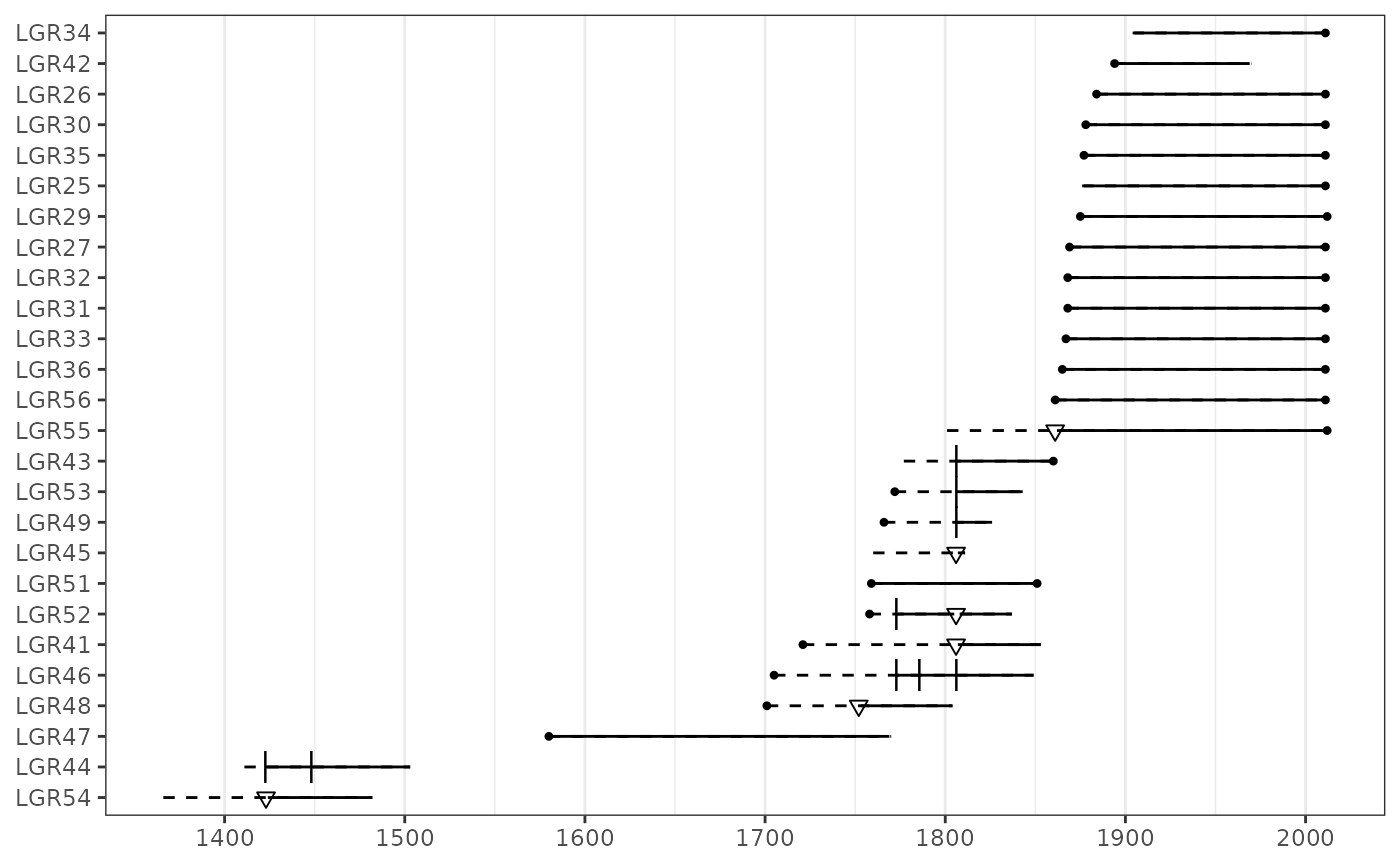
data(lgr2)
plot(lgr2)
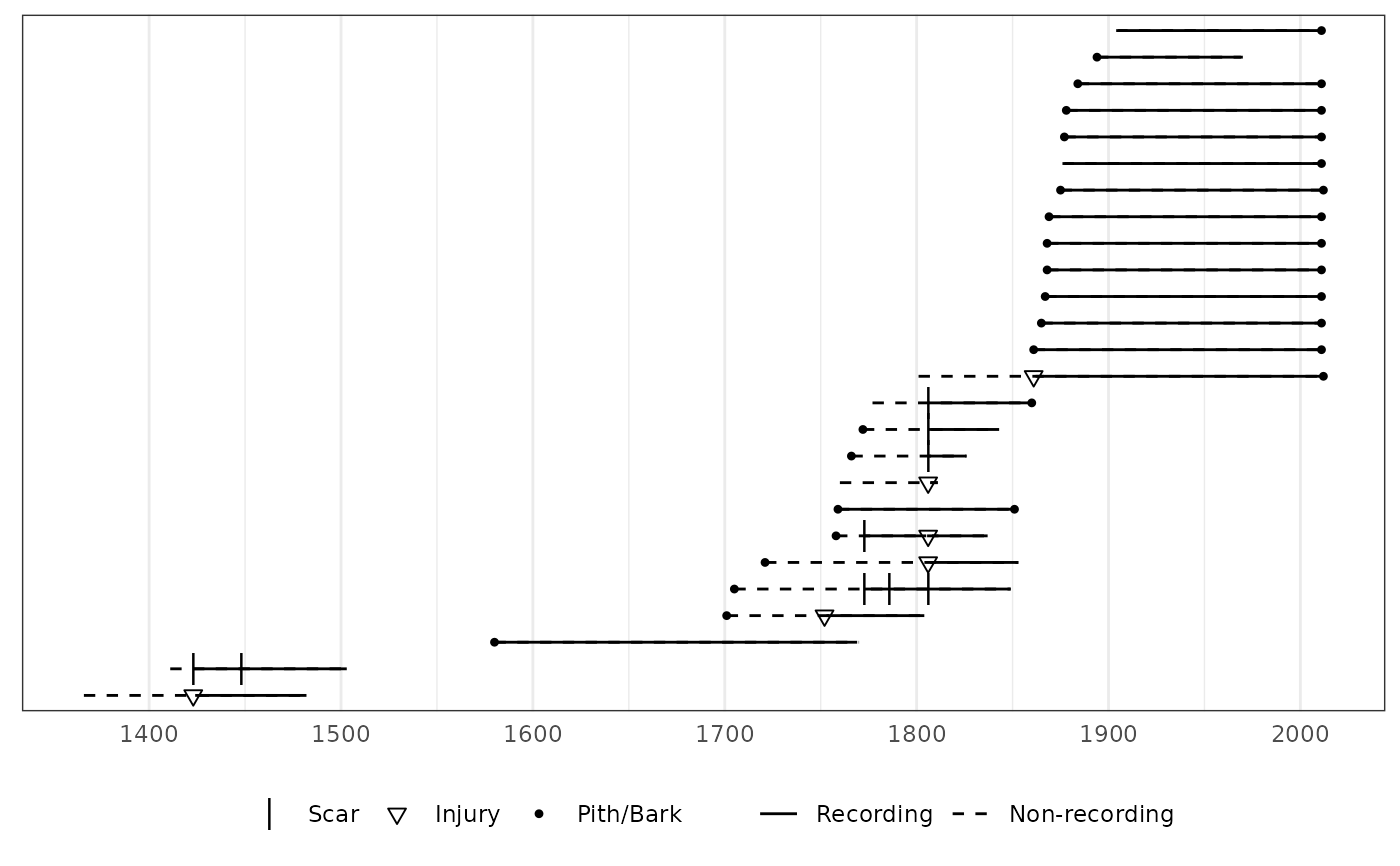
 plot(lgr2, ylabels = FALSE, plot_legend = TRUE)
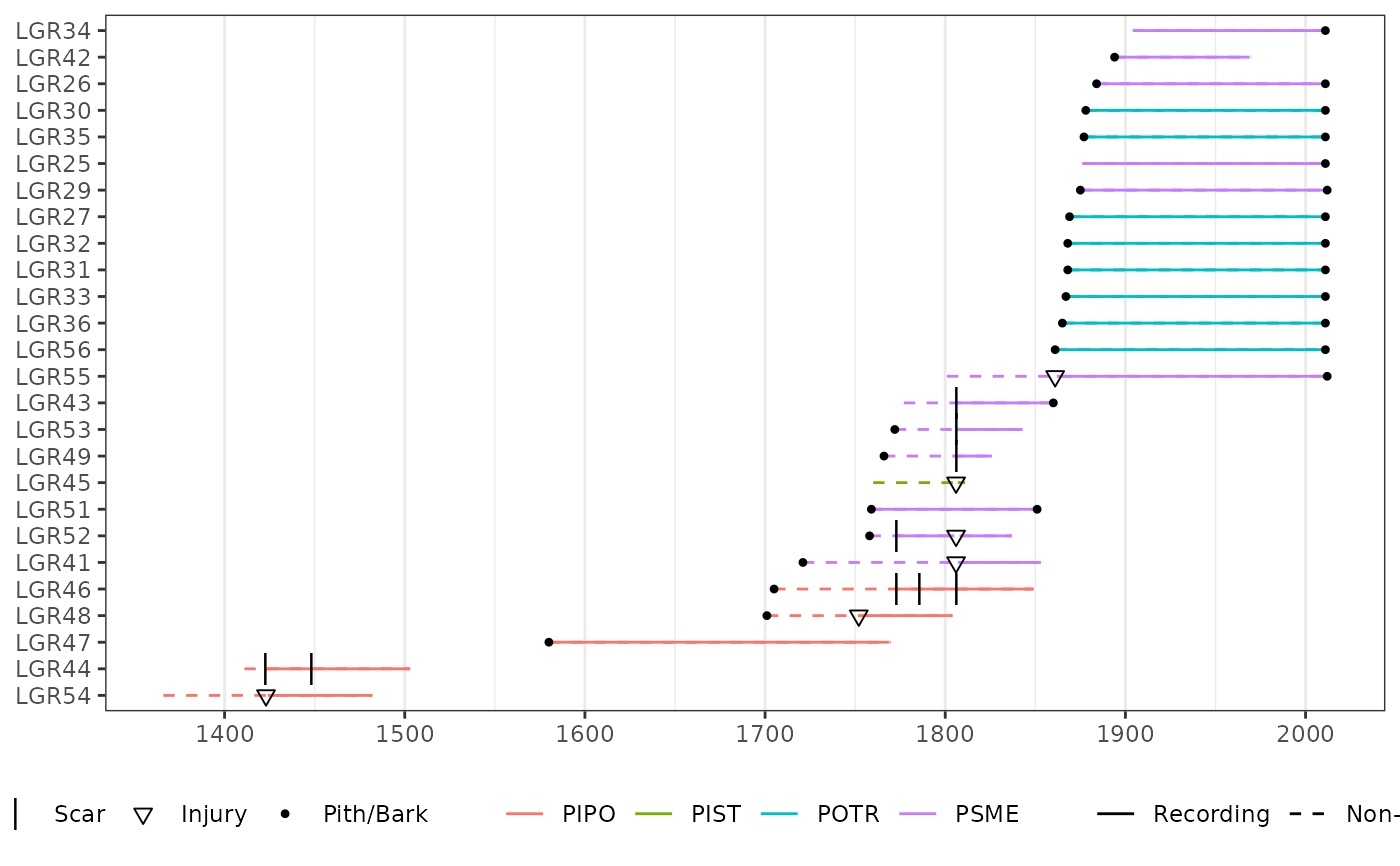
 data(lgr2_meta)
# With color showing species.
plot(lgr2,
color_group = lgr2_meta$SpeciesID,
color_id = lgr2_meta$TreeID,
plot_legend = TRUE
)
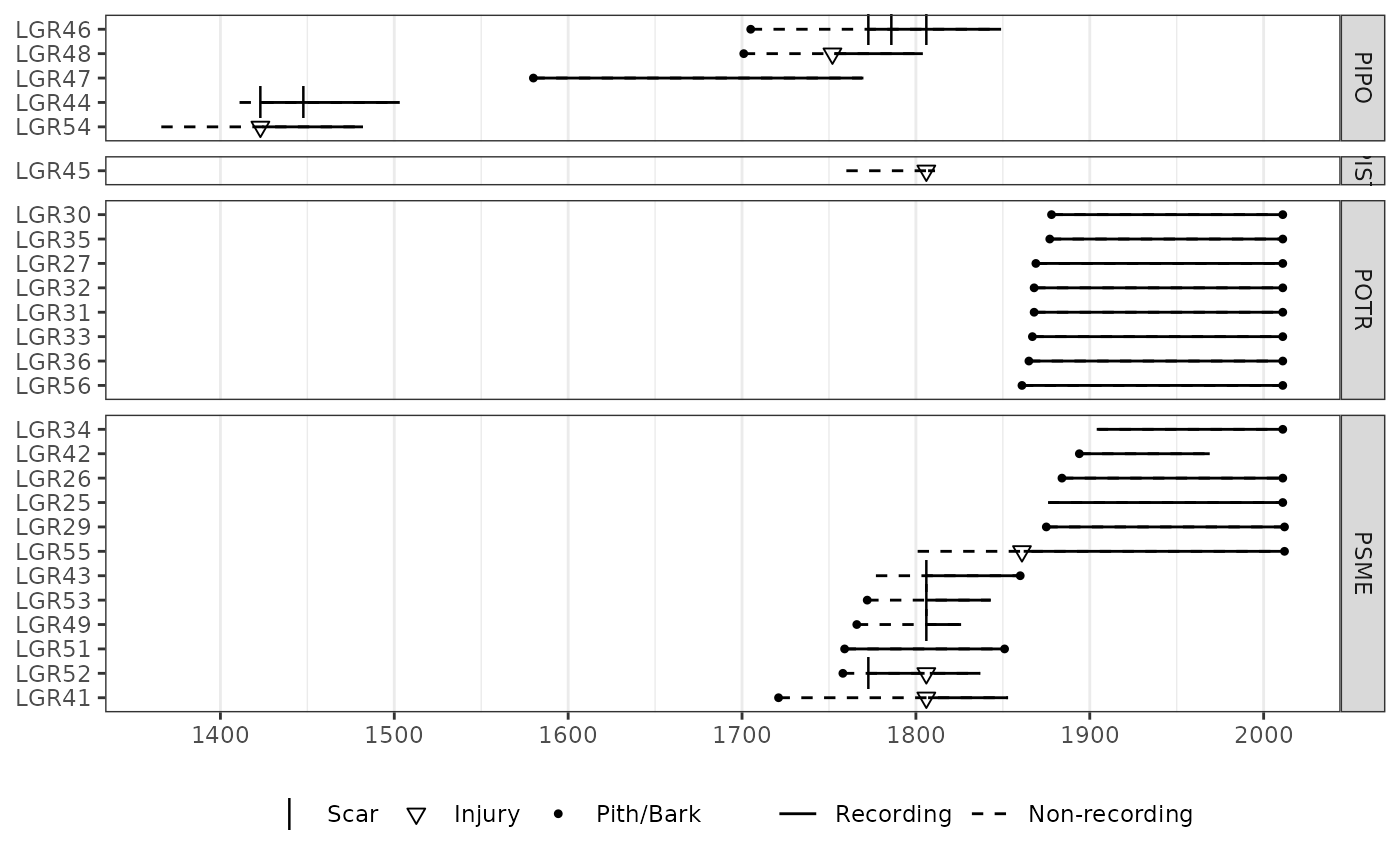
 # With facets for each species.
plot(lgr2,
facet_group = lgr2_meta$SpeciesID,
facet_id = lgr2_meta$TreeID,
plot_legend = TRUE
)
 # Append annotation onto a ggplot object.
require(ggplot2)
p <- plot_demograph(lgr2,
color_group = lgr2_meta$SpeciesID,
color_id = lgr2_meta$TreeID
)
# Add transparent box as annotation to plot.
p + annotate("rect",
xmin = 1750, xmax = 1805,
ymin = 3.5, ymax = 13.5, alpha = 0.2
)
